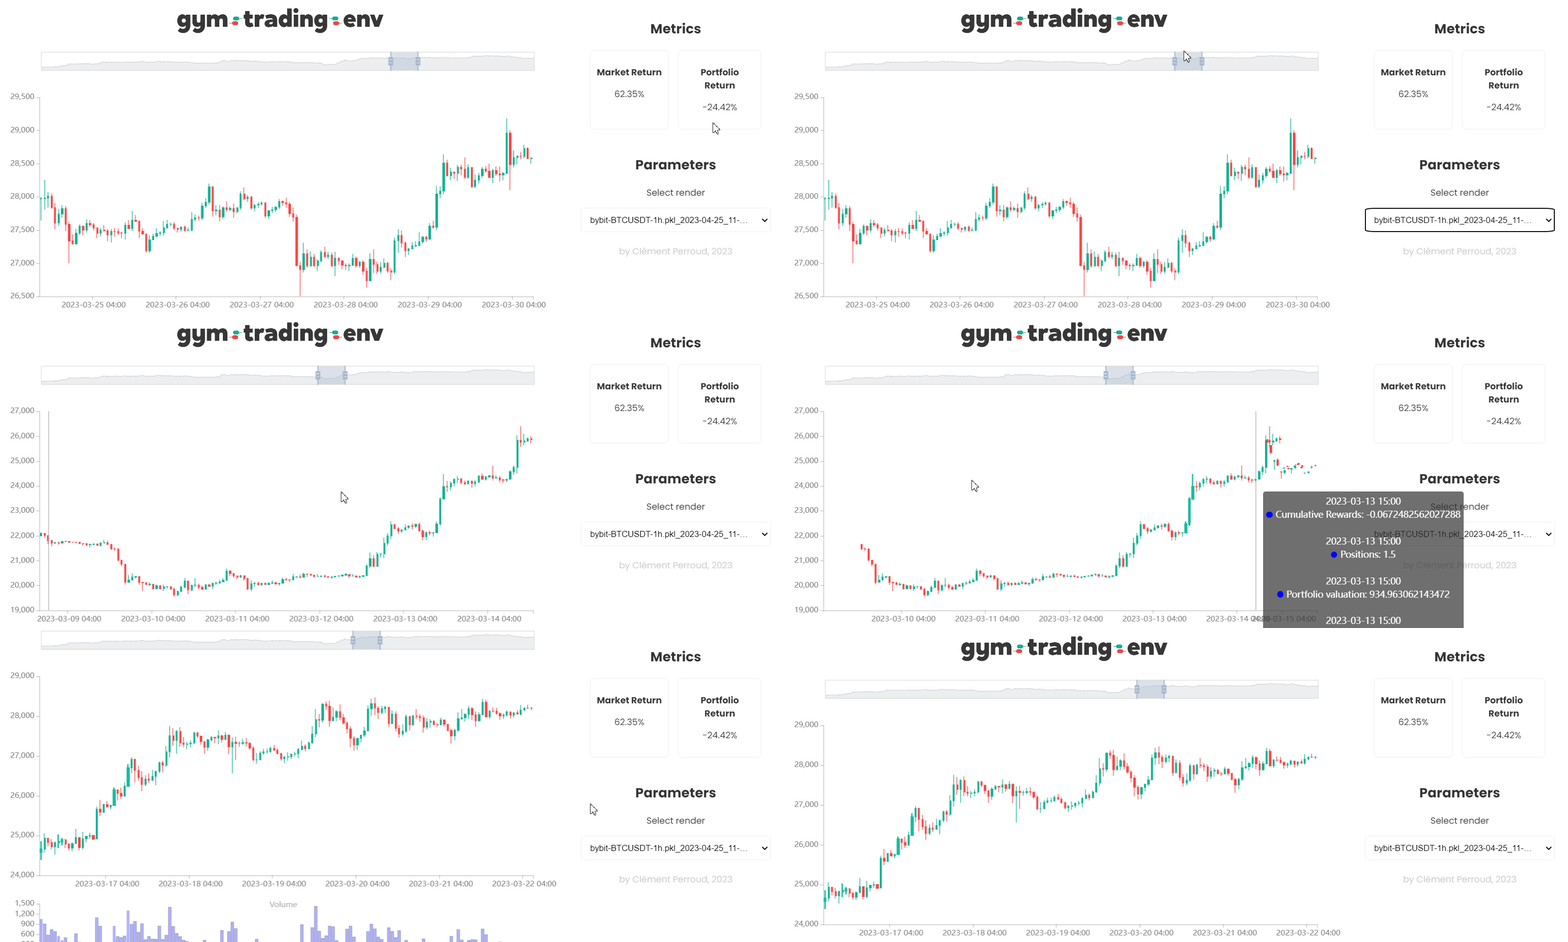
Render#
Note
The render runs with Flask on localhost as a web app, and the charts are drawn with the pyecharts librairy.
Your first render#
For the render not to perturb the training, it needs to be performed in a separate python script. This way you can explore your episode results without disturbing your RL-agent training.
In the running environment script, you need to save your render logs :
# At the end of the episode you want to render
env.save_for_render(dir = "render_logs")
Then, in a separate script :
from gym_trading_env.renderer import Renderer
renderer = Renderer(render_logs_dir="render_logs")
renderer.run()
...
* Running on http://127.0.0.1:5000
...
Go to URL mentionned by Flask (here http://127.0.0.1:5000)

Customize your render#
Add custom lines#
renderer = Renderer(render_logs_dir="render_logs")

# Add Custom Lines (Simple Moving Average)
renderer.add_line( name= "sma10", function= lambda df : df["close"].rolling(10).mean(), line_options ={"width" : 1, "color": "purple"})
renderer.add_line( name= "sma20", function= lambda df : df["close"].rolling(20).mean(), line_options ={"width" : 1, "color": "blue"})

renderer.run()
Add custom lines with .add_line(name, function, line_options) that takes following parameters :
name: The name of the line.function: The function takes the History object (converted into a DataFrame because performance does not really matter anymore during renders) of the episode as a parameter and needs to return a Series, 1-D array, or list of the length of the DataFrame.line_options(optional) : A Dict object that can have keyscolor(str) andwidth(int) to control the appearance of the plot.
Add custom metrics#
renderer = Renderer(render_logs_dir="render_logs")

# Add Custom Metrics (Annualized metrics)
renderer.add_metric(
    name = "Annual Market Return",
    function = lambda df : f"{ ((df['close'].iloc[-1] / df['close'].iloc[0])**(pd.Timedelta(days=365)/(df.index.values[-1] - df.index.values[0]))-1)*100:0.2f}%"
)
renderer.add_metric(
        name = "Annual Portfolio Return",
        function = lambda df : f"{((df['portfolio_valuation'].iloc[-1] / df['portfolio_valuation'].iloc[0])**(pd.Timedelta(days=365)/(df.index.values[-1] - df.index.values[0]))-1)*100:0.2f}%"
)

renderer.run()
Add custom metrics with .add_metric(name, function) that takes following parameters :
name: The name of the metrics.function: The function takes the History object (converted into a DataFrame) of the episode as a parameter and needs to return a string.